登陆查看更多优秀资源帖,与同道便捷交流讨论
您需要 登录 才可以下载或查看,没有帐号?立即注册
x
Abstract
Background:
Different methods have been described for data extraction from pathology reports with varying degrees of success. Here a technique for directly extracting data from relational database is described.
Methods:
Our department uses synoptic reports modified from College of American Pathologists (CAP) Cancer Protocol Templates to report most of our cancer diagnoses. Choosing the melanoma of skin synoptic report as an example, R scripting language extended with RODBC package was used to query the pathology information system database. Reports containing melanoma of skin synoptic report in the past 4 and a half years were retrieved and individual data elements were extracted. Using the retrieved list of the cases, the database was queried a second time to retrieve/extract the lymph node staging information in the subsequent reports from the same patients.
Results:
426 synoptic reports corresponding to unique lesions of melanoma of skin were retrieved, and data elements of interest were extracted into an R data frame. The distribution of Breslow depth of melanomas grouped by year is used as an example of intra-report data extraction and analysis. When the new pN staging information was present in the subsequent reports, 82% (77/94) was precisely retrieved (pN0, pN1, pN2 and pN3)。 Additional 15% (14/94) was retrieved with certain ambiguity (positive or knowing there was an update)。 The specificity was 100% for both. The relationship between Breslow depth and lymph node status was graphed as an example of lesion-specific multi-report data extraction and analysis.
Conclusions:
R extended with RODBC package is a simple and versatile approach well-suited for the above tasks. The success or failure of the retrieval and extraction depended largely on whether the reports were formatted and whether the contents of the elements were consistently phrased. This approach can be easily modified and adopted for other pathology information systems that use relational database for data management.
INTRODUCTION
Reporting major cancers with checklists/synoptic reports has been a mandated requirement by College of American Pathologists and the American College of Surgeons - Commission on Cancer.[1,2] The use of the synoptic reporting format helps to ensure the completeness of the reports and lessen the chance of pathologists omitting relevant information; format consistency also makes it easier for the treating physicians to grasp all the relevant information.[3,4,5] The standardization can, therefore, improve the quality of patient care.
The underlying mechanisms for generating and storing information for synoptic reports may vary, including both a continuous string of text and as structured individualized elements.[5,6] Since the communication of the information to the treating physician is text-based reports, this variability does not affect the treating physicians or the individual patients treated. However, it does have implications on how pathologists prepare the reports, whether there is added cost involved in generating the reports, how the data are reported to the cancer registrars, and how readily the underlying information can be retrieved and used for the purpose of research and quality assurance.
Different approaches have been used to extract individual elements in the pathology reports. Natural language processing (NLP) has been used to extract information from breast carcinoma pathology reports with variable degrees of success.[7,8] Recently, Boag described a simpler yet powerful approach: programing language R was used to extract and analyze data from discrete synoptic pathology reports (from the reports of prostate needle core biopsies)。[9] First, all the reports with synoptic reports of prostate needle core biopsies were retrieved using a built-in report retrieving mechanism of their pathology information system. These report texts were uniformly formatted and consistently phrased since they were generated by a third-party software that captures individual data elements discretely (mTuitive xPert© Cancer Reporting version 3 software, mTuitive Corporation, Centerville, MA, USA)。 Second, after file-type conversion, the texts were read into R, and the individual data elements were extracted and used for analysis.
Using melanoma of skin as an example, the above approach has been extended in the following ways: having R script directly interact with the database (through RODBC package), applying R to nonuniformly formatted and semi-consistently expressed report texts, and performing lesion-specific retrieval and analysis across multiple reports. The process is described in sufficient detail, including providing key portions of the R code, so as to enable readers with some R programing knowledge to test out the approach in their own systems.
MATERIALS AND METHODS
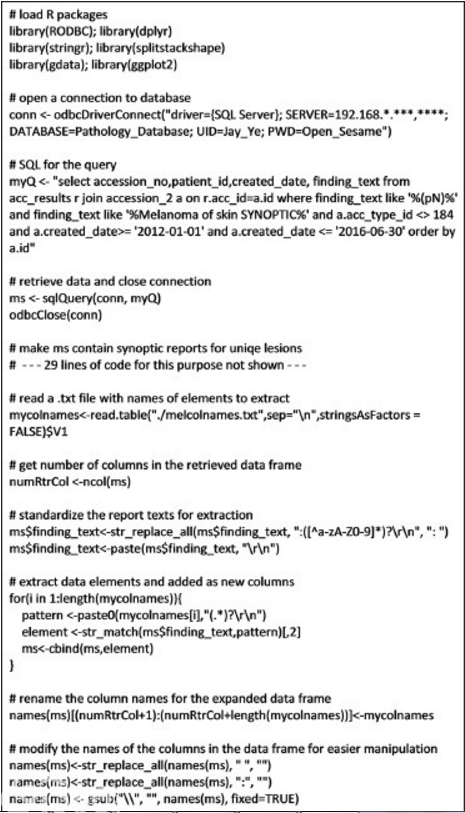
The computer workstation is a desktop PC with Intel(R) Core(TM) i5-3470 CPU @ 3.20GHz, 4GB RAM. The pathology information system is PowerPath 10.0.0.19 (Sunquest), with Advanced Material Processing module. The backend database management system for PowerPath is Microsoft SQL server 2005. Open source programing language R version 3.3.1 ( https://www.r-project.org) is used for interacting with PowerPath database and for data extraction, tidying, and analysis. RStudio version 0.99.489 ( https://www.rstudio.com) is the integrated development environment used for both running the R script and interactively analyzing the data. Figure 1 shows the R script used to retrieve data from the PowerPath database and to extract the elements of interest from the retrieved data. The lines starting with hash mark (#) are the comment lines for human readers only. The script first loads the required packages: RODBC, dplyr, stringr, gdata, splitstackshape, and ggplot2. It then makes a connection to the database, retrieves data, and closes the connection. The server IP address, UID, and PWD in the line to open a connection to database have been modified to protect the security of the system. The retrieved data are in the format of R data frame with 4 columns: accession number, patient id, created date, and text containing the melanoma of skin synoptic report.
Figure 1
R code for retrieving data from database and for performing preliminary data element extraction. Lines start with hash mark are comment lines, not executed by R interpreter. The content of the connection string in line “conn <- odbcDriverConnect(”driver={SQL Server}; SERVER = 192.168.*.***,****; DATABASE = Pathology_ Database; UID = Jay_Ye; PWD = Open_Sesame“)” is modified for confidentiality. Twenty-nine (29) lines of code for selecting out synoptic reports corresponding to unique lesions are omitted. See Materials and Methods for additional description
In our system, not every synoptic report represents a unique lesion. Reports of some lesions are copied and re-accessioned under a different case number for the subsequent molecular send out tests. These repetitions have the acc_type of 184 in our database and are excluded from the retrieval by adding the condition “a.acc_type_id <>184” to the WHERE clause of the query.
Among the retrieved synoptic reports, while most patients have only one synoptic report, a minority of patients have multiple different synoptic reports that represent the following situations: (1) one synoptic report for biopsies, followed by one for excisions with or without concomitant lymph node biopsies, (2) metachronous multiple primaries, and (3) synchronous multiple primaries. The following rules are set to programmatically obtain a data frame with each synoptic report corresponding to a unique lesion of melanoma. For patients with two synoptic reports, if the dates of these two reports are within 120 days, the second synoptic report is treated as the synoptic report for the excision specimen and only the second synoptic report is kept for data extraction. If the two reports are more than 120 days apart, the synoptic reports are treated as two different primary melanomas and both reports are kept for data extraction. If the patient has more than two reports, only the last one is kept for data extraction. Since these are futures idiosyncratic to our system, the code to obtain a data frame containing synoptic reports for unique lesion is not discussed in detail.
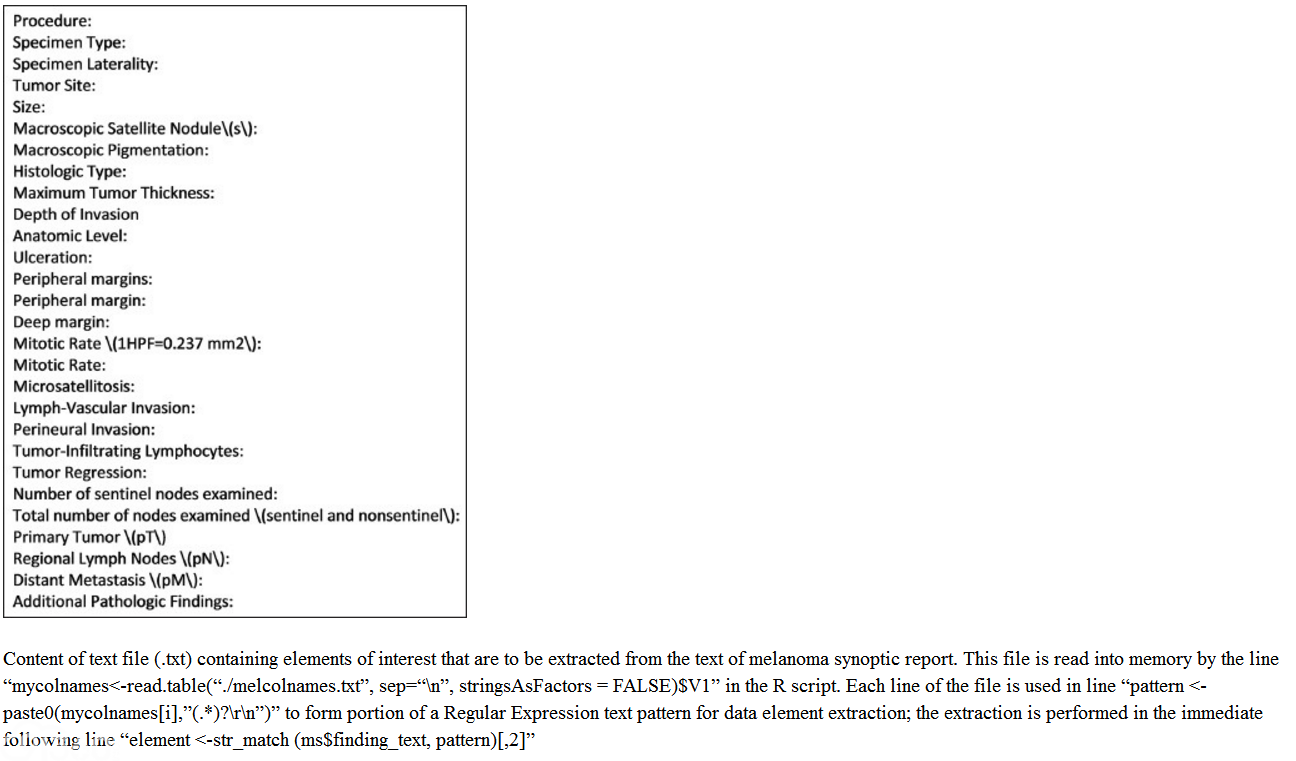
Then, the script reads a. txt file [Figure 2] into memory so that it has the information as to what elements to extract. Subsequently, the script extracts the elements of interest from the retrieved data and adds each element as a new column of the data frame.
Figure 2
Combining Breslow depth of melanoma obtained from two different formats of synoptic reports, extracting the numeric value and the subsequent summary analysis using these values are shown below:
The two columns of data “MaximumTumorThickness” and “DepthofInvasion” can be merged to form a new column “depth”:
Depth<-coalesce (ms$MaximumTumorThickness, ms$DepthofInvasion)
Then, the merged data can be used to extract the numeric portion of the text, converted to the R numeric data type, and added to the original data frame:
pured<-str_match (depth,“([0-9.]{1, 5})(.*)?(mm millimeter)”)
Breslowdepth<-as.numeric (pured[,2])
ms<-cbind (ms, 'BreslowDepth (mm)‘ = Breslowdepth)
Using the case number of retrieved list of cases, for each case, the script goes back to PowerPath database to retrieve subsequent reports within 120 days of the synoptic report for the same patient. Patient ID associated with the accession number of the synoptic report is used to bridge the synoptic reports and the subsequent reports. The particular query used in our system is as follows (myAccNum is the variable containing the accession number of the synoptic report):
DECLARE @acc_num varchar (60) SET @acc_num myAccNum
SELECT accession_no, COALESCE (finding, finding_text) as report
FROM path_rpt_heading as heading JOIN acc_results r on heading.id=r.heading_id JOIN accession_2 a on r.acc_id=a.id
WHERE acc_id in (select id from accession_2 where patient_id=(select patient_id from accession_2 where accession_no = @acc_num)) AND a.accession_no > @acc_num AND a.created_date <= (select dateadd (day, 120, a2.created_date) from accession_2 a2 where a2.accession_no = myAccNum) AND a.acc_type_id <>184 AND accession_no LIKE 'S-%' AND (heading.name LIKE 'COMMENT%' OR heading.name LIKE 'DIAGNOSIS%' OR heading.name LIKE 'AMENDED DIAGNOSIS%’)
PowerPath implemented the database table in such a way that each section of the report text, such as DIAGNOSIS, COMMENT, CLINICAL INFORMATION, GROSS DESCRIPTION, and so on, is stored in different rows, and they are stored in either column “finding” or column “finding_text” (but not both) depending on the length of the text for the given section. The column-wise concatenation was performed within SQL query using the function COALESCE, and the row-wise concatenation for each report was performed within R. The resulting data frame “reportbycase” contained DIAGNOSIS, COMMENT, AND AMENDED DIAGNOSIS section of the report text for each retrieved report.
These reports are used for the extraction of potential new staging information. Many reports of lymph node biopsies contain a summary sentence in the comment such as “the updated melanoma stage is pT1a, pN0, and pMX.” The staging information from such reports can be extracted using the following R code:
reportbycase$pT <-str_match (reportbycase$report,“(melanoma|Melanoma)(.*)?(pT[a-oq-wyzA-MO-WYZ0-9]{1,3})”)[,4]
reportbycase$pN <-str_match (reportbycase$report,“(melanoma|Melanoma)(.*)?(pN[a-oq-wyzA-WYZ0-9]{1,3})(.sn.)?”)[,4]
reportbycase$pM <-str_match (reportbycase$report,“(melanoma|Melanoma)(.*)?(pM[a-oq-wyzA-WYZ0-9]{1,3})”)[,4]
The following code is used for the report text when the extraction described above returns NA:
for (i in 1:numRpt){
if (is.na (reportbycase$pN)){
if (!is.na (str_match (reportbycase$report,“(Melanoma|melanoma|Melan)”)) and !is.na (str_match (reportbycase$report,“(Sentinel|sentinel ||node)”))){
if (!is.na (str_match (reportbycase$report, “([1-9]/”))){
reportbycase$pN <- 'pNp'
} else if (!is.na (str_match (reportbycase$report, “([0]/”))){
reportbycase$pN <- 'pN0'
} else {
reportbycase$pN <- 'pN?'
}
}
}
}
The above code utilizes the observation that many lymph node reports, even without summarizing sentences, would include the ratio of positive nodes to the total number of nodes within parentheses in the diagnosis for each specimen such as 0/1 denoting one node being negative and 2/3 denoting two of three nodes being positive. Three potential results can be retrieved: pN0, pNp (at least one node is positive), and pN? (there is a lymph node biopsy, but the result is not automatically retrievable)。
The highest stage obtained from all the subsequent reports is used as the updated staging information for that patient. The highest stage for pT, pN, and pM is selected out from all the reports using the following code:
pT_u <- as.character(max(reportbycase$pT, na.rm = TRUE))
pN_u <- as.character(max(reportbycase$pN, na.rm = TRUE))
pM_u <- as.character(max(reportbycase$pM, na.rm = TRUE))
This process is repeated for each synoptic report.
The relationship between the lymph node status and Breslow depth of melanoma was then explored to demonstrate that information dispersed among different reports can be collated and used for data analysis.
RESULTS
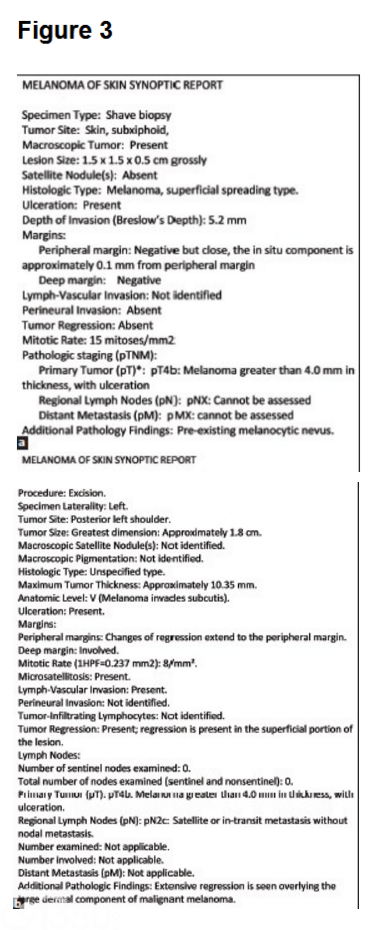
Two dermatopathologists in the group happen to have used different synoptic reports for melanoma of skin[Figure3a and b]. This necessitates the R script to be written in such a way that information from both synoptic reports is extracted. Figure 2 is a file containing the elements of interest from both formats of synoptic reports. If the text of the element of interest contains parentheses, a backslash (), which is an escape character for regular expression, needs to be added before both the open parenthesis and close parenthesis.
(a) An example of melanoma of skin synoptic report by pathologist A. (b) An example of melanoma of skin synoptic report by pathologist B
When an R script depicted in Figure 1 [with the connection string modified, see figure legend for Figure 1] is run to retrieve from 4½years of data of roughly 50 k cases/per year database (approximately 14 k skin cases/year), 440 synoptic reports are retrieved. Four hundred and twenty-six synoptic reports are considered to represent unique lesions using the rules described in Materials and Methods for programmatic selection. Seventeen patients have two synoptic reports. Eight of them have the pairs <120 days apart and are correctly classified as re-excision of the same lesion; only the second synoptic reports are retained. Nine have the pair of synoptic reports more than 120 days apart, and they are correctly classified as metachronous primaries; both synoptic reports are retained. Two patients have three and five synoptic reports, representing two and four primaries, respectively. Only the last synoptic reports of these two patients are included; the others (a total of four lesions) are excluded due to the unmanageable complexity of multiple lesions. There are also two patients with two synchronous primaries (two synoptic reports within the same report); they are included in the within-report summary but excluded from searching for the updated staging information from the subsequent report (value for column “cannot update” is set to TRUE [Figure 4a]) since the script does not have a good way to attribute which update goes to which primary. The result is an R data frame with 426 rows and 33 columns (four columns are retrieved data, one column is “cannot update,” and 28 columns are extracted elements).
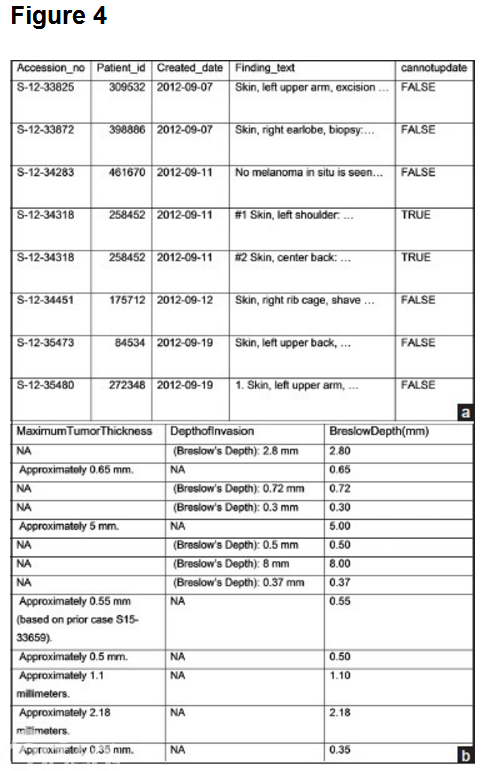
(a) Microsoft Word table rendition of portion of R data frame showing the four columns of retrieved data and one column of generated element. The first four columns such as “accession_no,” “patient_id,” “created_date,” and “finding_text” are data retrieved from PowerPath database. The 5th column “cannotupdate” is used subsequently to determine if updated staging information will be obtained from the subsequent reports. The content of “finding_text” contains large chunks of text data including the synoptic reports; only the first few words are displayed in the table. (b) Microsoft Word table rendition showing portion of an R data frame containing two columns of extracted elements and one column of tidy data (BreslowDepth[mm]) derived from the first two columns
A portion of this initial R data frame generated by the script is converted to Microsoft Word table format and shown in Figure 4a.
Figure 4b depicts the three depth-related columns of data that have been subsetted out (selected out) for the demonstration purpose.
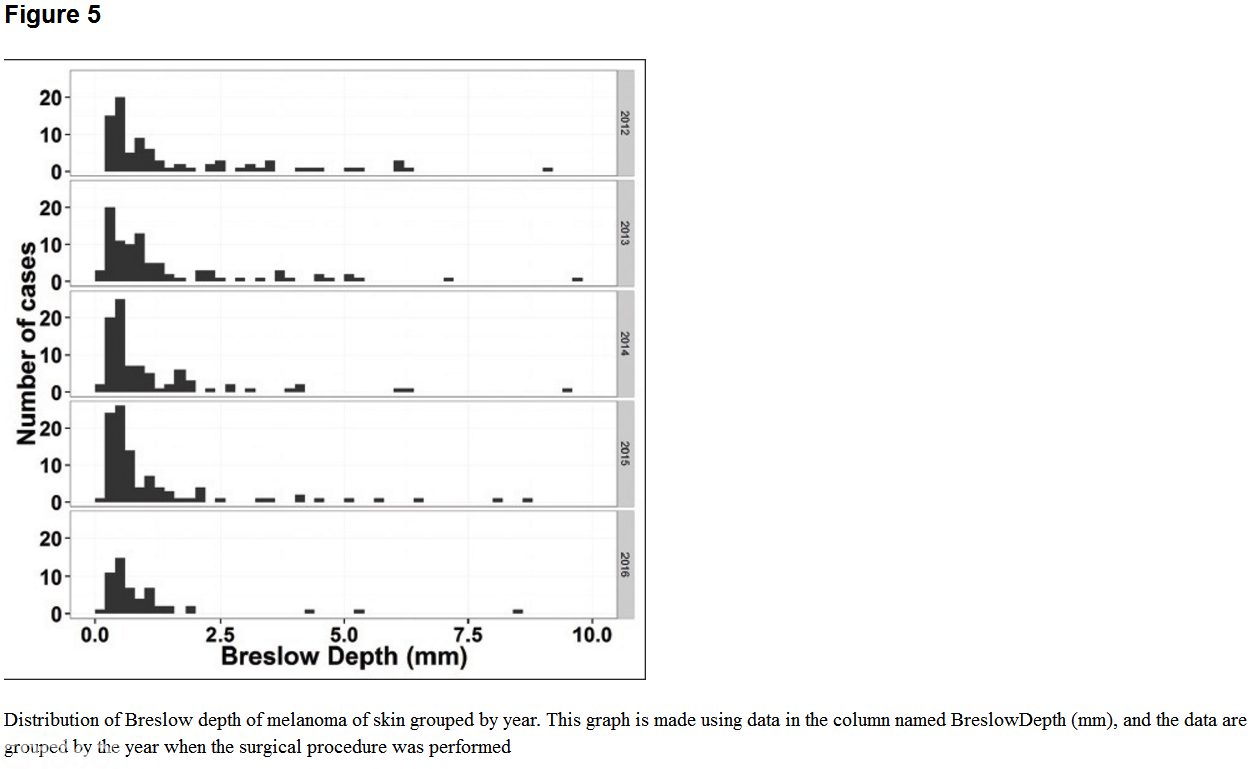
Using the data in column “BreslowDepth(mm)” and a new column containing year information extracted from column “created_date,” distribution of Breslow depth grouped by year can be plotted [Figure 5].
The data retrieval and analysis described above is based on the individual reports that contain the melanoma of skin synoptic reports. Many patients have multiple subsequent reports that might contain additional information such as lymph node status and distant metastasis. The script uses the case numbers obtained from the initial retrieval to go back to the database to retrieve any additional reports on the same patient within 120 days of the synoptic reports.
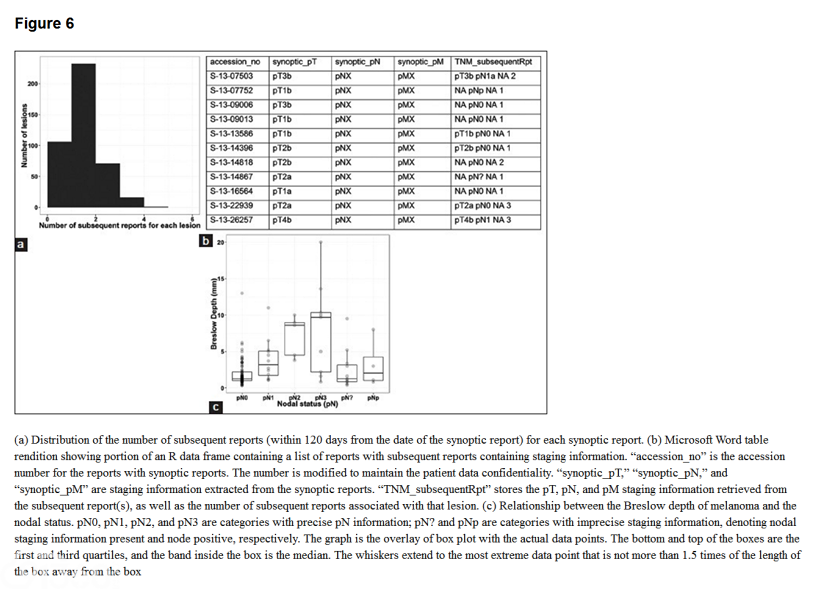
Figure 6a shows the distribution of the number of subsequent reports for each synoptic report. For these 422 lesions (four lesions are excluded because they represent two synchronous primaries from two patients, and the current script does not have the ability to discern which primary the update information should be attributed to), a total of 424 subsequent surgical pathology reports exist within 120 days from the dates of the synoptic reports, with a median of 1 and an average 1.0.
Figure 6b shows portion of the data frame containing staging information from both the original synoptic reports and subsequent reports.
All of the above synoptic reports and the subsequent pathology reports associated with the synoptic reports are reviewed manually.
There is no useful update information on pT in any of the cases; all the pT information is from the synoptic reports.
There are a total of 94 opportunities for pN update. In 54 of them, the subsequent reports on lymph nodes contain the summary sentence that summarizes pT, pN, and pM; pN is retrieved correctly from each one of them. In 27 reports, the ratio of positive to total number of nodes is present within the diagnoses of the lymph nodes; 23 of them were retrieved as pN0 and 4 of them were retrieved as pNp (the current script knows that the nodes are positive but does not have a way to know how many are positive)。 In ten reports, the reports do not contain either summary sentence or put the ratio of nodes within a pair of parentheses; the script retrieves “pN?” (there is at least one lymph node biopsy, but the script cannot extract the results)。 There are three cases that are beyond 120 days from the date of synoptic reports, and the information is not retrieved. In summary, the current script retrieves the pN information precisely with an 82% sensitivity ([54 23]/94)。 An additional 15% has partial information retrieval ([4 10]/94)。 The remaining 3% is not retrieved. The specificity of retrieved results is 100%, i.e., there is no erroneous retrieval. For nine pairs of metachronous primary melanomas, two pairs have updated pN information for one of the two lesions. Each was retrieved and correctly assigned to the corresponding primary. Setting the 120 days limit also prevents erroneously updating the pT information of the first lesion by the pT of the second lesion.
This combined data (without additional human intervention to convert partial retrieval to precise retrieval) are used to graph the relationship between Breslow depth and nodal status [Figure 6c]. Breslow depth is extracted from the original reports with synoptic reports. The nodal status represents combined data from both the original reports with synoptic reports and reports on the subsequent specimens from the same patients. With human intervention to retrieve the pN information by reading the reports that the script partially retrieves the information (14 lesions), a plot with precise information can also be obtained with minimal added effort (graph not shown)。 This relationship is not a new finding in melanoma. The graph is used here to demonstrate that this approach can be used to extract data from different reports of the same patients to perform a meaningful analysis.
The Breslow depth is extracted from the original reports with synoptic reports. Nodal status represents combined data from both the original reports with synoptic reports and reports on the subsequent specimens from the same patients.
There is no useful update information on pM in any of the cases since we have not reported the updated pM staging information in an easily extractable fashion when a distant metastasis has been detected in subsequent specimens.
DISCUSSION
Synoptic reports differ from free-text reports in that the synoptic reports are formatted in such a way that the reports contain a list of elements, and each element has a descriptive header preceding it. The format consistency of the synoptic reports not only assists pathologists in generating reports that are complete but also makes it easier for the treating physicians to gather information from the reports.[2,3,4]
In this article, melanoma of the skin is used as an example and programing language R as a tool to demonstrate that individual data elements included in the text within cancer synoptic reports can be extracted directly from relational database and analyzed in a lesion-specific fashion. The formatted nature of the synoptic reports and the consistent nature of how pathologists phrase the contents of the elements are two crucial features making the above tasks possible.
From the computational point of view, a “formatted report” simply means that the elements of interest are tagged. For example, the histologic grade of the neoplasm is always preceded by “Histologic grade:” so that R script knows where to extract the element histologic grade. With these tags, the sensitivity and specificity of the element extraction should be 100%.
From the results section, one can see that both dermatopathologists use synoptic reports to report melanoma of the skin. However, each one uses a different synoptic report. This lack of uniformity is unintended and is not good practice. However, it does provide an opportunity to demonstrate the flexibility of the approach in handling the variability in report formats.
Thus, as long as the elements are tagged, whether they are uniformly tagged, or there are several varieties of tagging the same elements, the sensitivity of extraction is not affected. The variability does require additional steps in the subsequent data processing, i.e., requiring the data from the mutually exclusive columns in the R data frame to be combined into a single new column.
The ease of data analysis is mostly determined by how consistently the contents of the elements are phrased. For Breslow depth, a small degree of variability exists but does not pose any difficulty in extraction. For, pT, pN, and pM, the expression is nearly 100% consistent. For the margin status, one pathologist uses “positive” and “negative” and one uses “involved” and “uninvolved.” These differences do not pose difficulty in summarizing the data.
In extracting the new staging information from the subsequent reports, there is no specific tag to use; as such, the consistency in phrasing is even more important. It is a pleasant surprise that without prospective planning or prospective emphasis on consistent phrasing, 82% of the lymph node staging information in our database can be extracted precisely with 100% specificity.
Since relational database (SQL database) is the backend for the majority of the pathology information system and R script can run in many different platforms, the approach described here can be used in different pathology information systems to retrieve individual data elements from formatted pathology reports.
The previously reported methods for data extraction used two-step approaches[7,8,9] including obtaining the report texts in step one and performing extraction and analysis in step two. The integrated one-step approach enables the second round of queries of database using the results of the first query. This allows the retrieval of information from other reports of the same patients (lesions), instead of limiting the analysis to individual reports.
The insights gained from this project have modified how we write our reports. Now, only one format of synoptic report for melanoma of the skin is used. Furthermore, a summary sentence is consistently used when encountering specimens that add staging information. Incorporating these small changes into our practice is not burdensome and will have beneficial effects on the future data extraction.
R is an open source programing language that many data scientists use. There is no cost associated with using the language. Although to state that using R is easy is not true, one does not need to be a computer scientist to be able to learn and use R. I believe that using R as described in this article is easier than using the more complex approach of NLP. The inclusion of R code for the key portions of the task is to make any potential attempt to duplicate this approach in other systems easier.
CONCLUSION
Formatted pathology reports, such as but not limited to the cancer synoptic reports, can avail themselves to relatively simple data extraction and analysis using R extended with RODBC package. The integrated one-step approach has two advantages: (1) it is not dependent on the retrieval capability of the specific pathology information system and thus can be used in any systems that use relational database as the backend; and (2) it allows data extraction to occur across the boundaries of the pathology reports from multiple reports of the same patient for the disease or lesion of concern.
| 


 发表于 2017-12-20 18:30:57